Why use Visualisations?
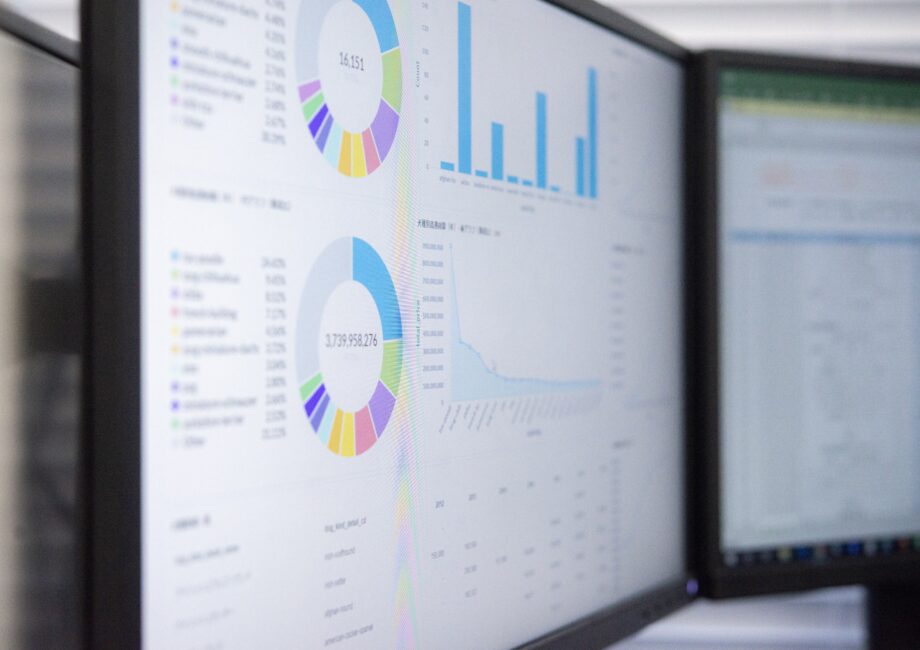
You won’t need to worry about Excel spreadsheets, from employees, find out the succession of production processes, their continuity or have difficulties finding errors. We will process the production data for you and you will get clear charts and Visualisations to help you optimise your production processes. All compiled into functional units.
There are a wide range of data Visualisation tools, from simple charts and tables to complex software platforms. The choice of tool depends on the specific needs and requirements of the industry and the client.
Data Visualisation is a very useful tool that can help industrial enterprises achieve significant improvements in productivity, efficiency, quality and safety.

What does data Visualisation in industry look like?
Production trend charts
Show the development of key performance indicators (KPI) such as productivity, quality or cost.
Process map
Visual representation of the production process emphasising material and information flows.
Failure charts
Show analyses to easily see the frequency and types of failures, with the ability to identify their main causes.
Predictive maintenance presentation
Data Visualisation to identify patterns that indicate an impending failure.
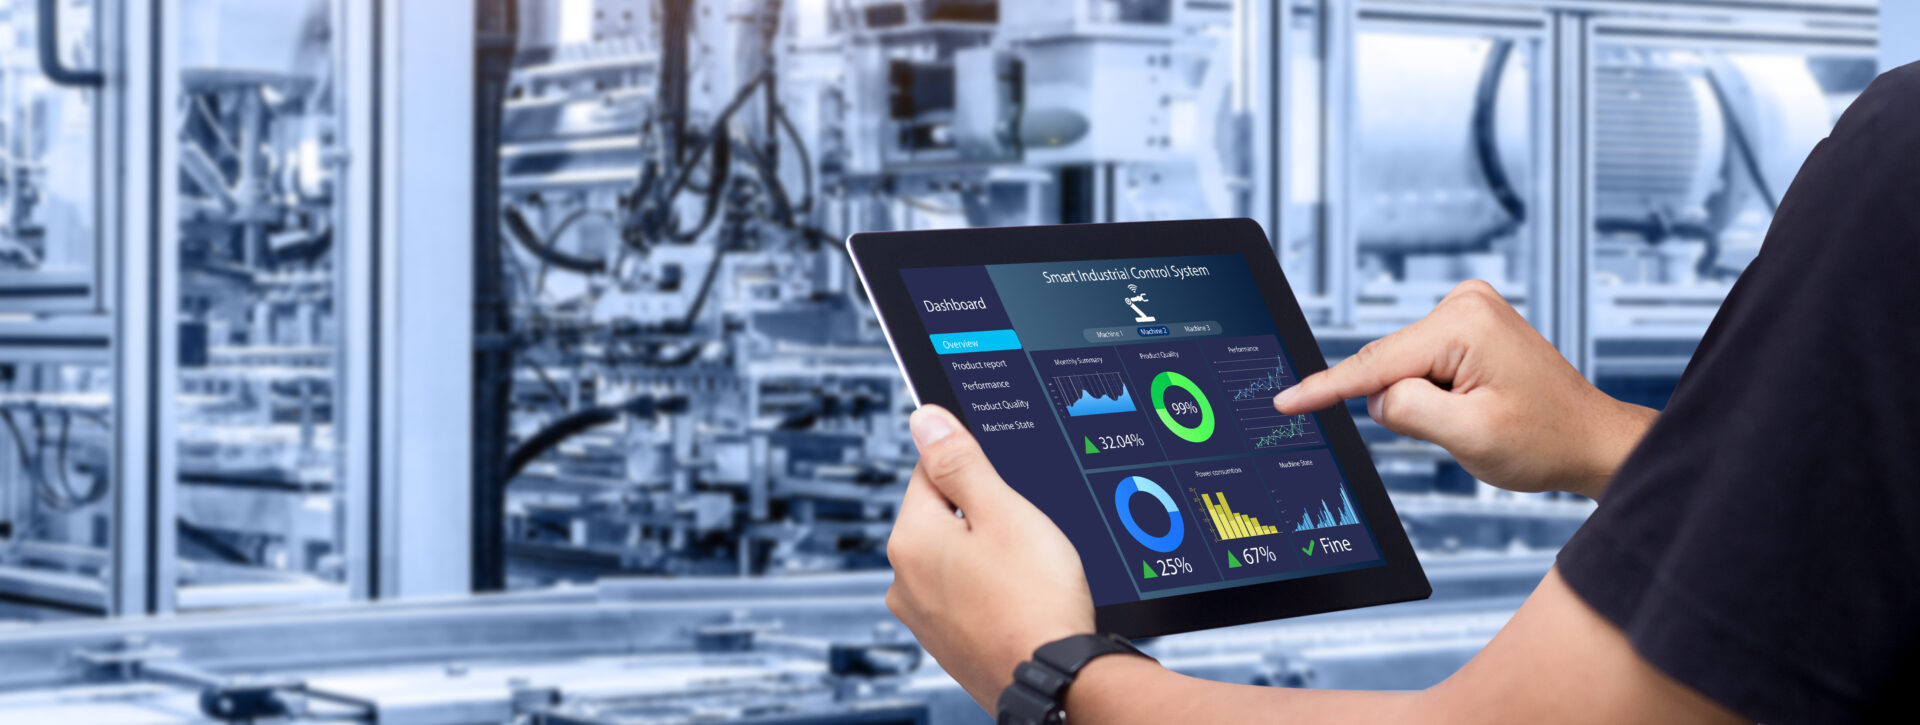
Dashboards
Interactive overviews of key performance indicators (KPI) with the ability to filter and analyse data.

Type distribution of Visualisations
Visualisations of production data
Charts, graphic elements or dashboards showing key indicators of a production process. E.g. production performance, use of equipment, quality of outputs, duration of operations, etc. These Visualisations help managers and workers on the production line better understand the current state and performance of production operations.
Visualisations of production processes
Diagrams, animations or videos showing production processes and procedures. These Visualisations can be used for training workers, identifying possible improvements in processes and optimising production operations.
Visualisations of warehousing and logistics
Graphical representations of storage and logistics operations. E.g. warehouse maps, shipment tracking or distribution planning. These Visualisations enable efficient management of storage and distribution processes.
Visualisations of equipment status
Dashboards and visual indicators showing the monitored status of production equipment and machines. This may include displaying operating parameters, maintenance status, alerts and alarms to detect and resolve potential problems in a timely manner.

Benefits of data visualisation
Better understanding of processes and data
With data visualisation, you can view complex data in graphical form, making it easier to understand trends, relationships and anomalies. It helps managers and operators better understand production processes and identify potential problems in a timely manner.
Production optimisation
Data Visualisation enables timely identification of inefficiencies and losses in the production process. Costs are reduced and productivity is increased.
Predictive maintenance and failure prevention
With data visualisation, you can analyse historical data and identify patterns that indicate an impending failure. This enables preventive (predictive) maintenance and prevents unplanned outages that lead to downtime and losses.
Higher quality products
With data visualisation, you can monitor the parameters of the production process and quickly identify deviations from standards. By adjusting the process in a timely manner, you will ensure higher product quality.
Cooperation, communication and decision-making support
With data visualisation, you can share information about production processes and data with managers, operators, technicians and other stakeholders. It facilitates cooperation and communication and promotes informed decision-making.
Interested in the cooperation process?
We have a process in place.
We transform and optimise processes in various industries, in enterprises of various sizes. Using individual steps that change the routine activities in your company, we streamline the individual processes or applications that you use. We also modify entire sections of your company or restructure it.
Contact us